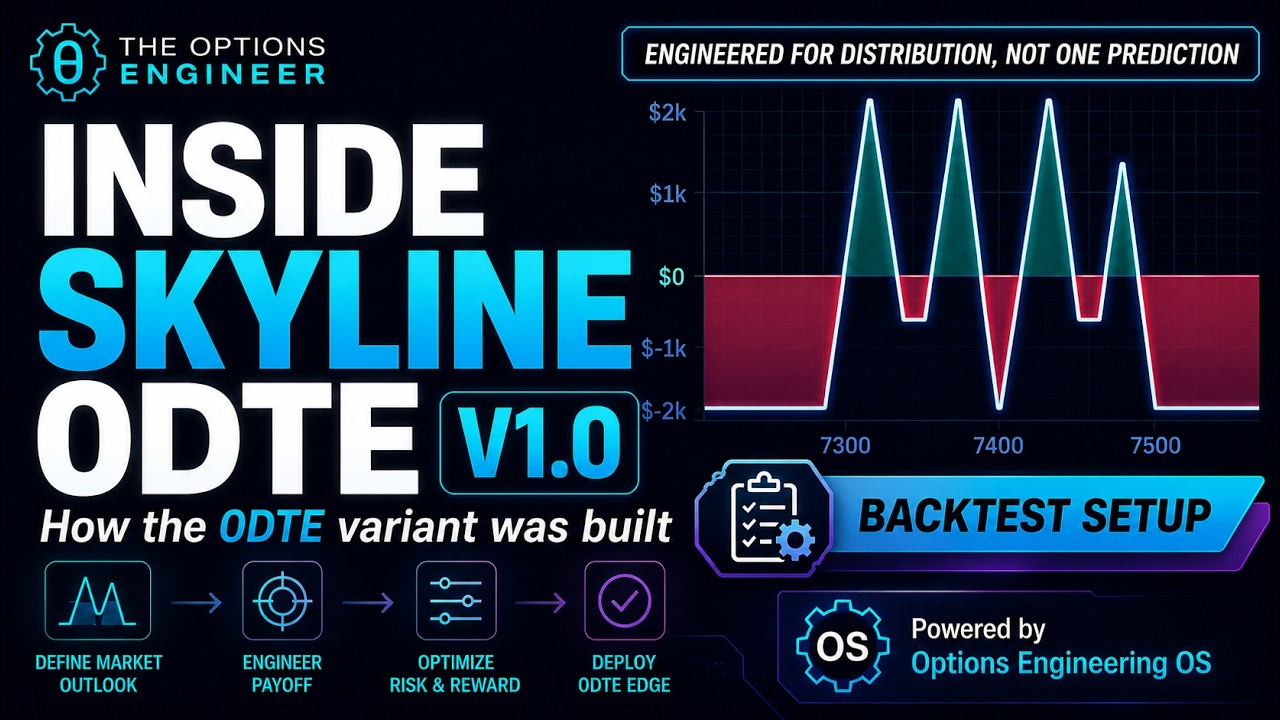
Skyline Strategies by The Options Engineer
Powered by the Options Engineering Framework & OS · Patent Pending

Explore Skyline

Build income strategies you can actually stay with.

Skyline is designed around return potential, risk shape, market tolerance, and psychological holdability.

The objective is not just an attractive payoff diagram. It is a repeatable income process that gives traders and investors clearer risk boundaries, more deliberate choices, and a better chance of following the intended plan—as one defined-risk component within a broader portfolio.

Skyline Butterfly 0DTE V1.0 Snapshot

Published backtest summary

Educational case study
Historical net P/L +$71,618 $5,000 → $76,618
433 paired deployments
Profitable deployments 53.6% Daily deployment basis
Skyline Butterfly 0DTE V1.0
Profitable months 76.0% 19 of 25 months
Jul 2024–Jul 2026
Profitable quarters 100.0% 9 of 9 quarters
Historical simulation
2 Skyline lots · 25-point iron condor comparison · Jul 23, 2024–Jul 22, 2026
Hypothetical, unaudited backtest results—not actual account performance. Monthly and quarterly figures represent profitable calendar periods, not trade win rates. Costs, slippage, execution quality, liquidity, and changing market conditions can materially affect outcomes.
View methodology and limitations →
THE SKYLINE INCOME PROCESS
Define the objective
Follow the lifecycle
Review the evidence
Featured Skyline research

Three studies. Three views of risk, structure, and capital efficiency.

Start with the published Skyline backtest, then compare its historical behavior with a 25-point iron condor and a longer-duration 14DTE study.

Study 01 · Public backtest

Skyline Butterfly 0DTE V1.0 Backtest

The primary reference for the interview configuration, including the original saved test, higher-cost sensitivity, and starting-capital sensitivity.

297.4% Original modeled CAGR from a $5,000 starting balance
-54.2% Original modeled maximum drawdown
265.4% Modeled CAGR under the higher-cost sensitivity
189.8% Modeled CAGR in the $10,000 starting-capital sensitivity

Includes direct links to all three saved Option Omega backtests, methodology, assumptions, and limitations.

Review the public backtest →
Study 02 · 0DTE comparison

Skyline Butterfly 0DTE V1.0 vs. 25-Point Iron Condor

A matched SPX 0DTE study comparing two Skyline Butterfly 0DTE V1.0 lots with one iron condor on an approximately CAR-aligned basis.

~244% higher Skyline modeled net P/L versus the iron condor over the matched study period
~18% lower CAR Modeled Skyline CAR in the tested 2-lot versus 1-lot comparison
76% vs. 68% Profitable months: Skyline versus iron condor
100% vs. 78% Profitable quarters: Skyline versus iron condor

Skyline had a lower profitable-deployment rate than the iron condor, reinforcing that win rate alone did not explain the longer-horizon outcome. The comparison is approximately CAR-aligned, not perfectly equal-CAR.

Explore the 0DTE comparison →
Study 03 · 14DTE comparison

Skyline Butterfly 14DTE V1.0 vs. 25-Point Iron Condor

A longer-duration comparison of Skyline Butterfly 14DTE V1.0 focused on net P/L, time in market, and portfolio-level CAR across overlapping positions.

49.6% more Modeled net P/L for Skyline in the tested configuration
4.1 fewer Average days in each Skyline trade
19.7% lower Estimated Skyline portfolio CAR across concurrent open positions
5.9 vs. 8.7 Average concurrent positions: Skyline versus iron condor

The tradeoff: Skyline required a higher opening debit and more recorded capital generally committed while overlapping positions were open.

Explore the Skyline Butterfly 14DTE V1.0 study →
Why the method matters

Good research should explain what the strategy is designed to tolerate.

The Framework connects payoff shape, CAR, holding assumptions, market movement, adjustment criteria, and review so Skyline is evaluated as a complete process.

Holdability is not a promise of comfort. It is a design goal: clearer boundaries, fewer ambiguous decisions, and a better chance of following the intended plan.
ILLUSTRATIVE TRADER EXPERIENCE

“The trade was working. The market moved, I exited—and then it came back.”

The Options Engineering question is not simply whether the exit was right or wrong. It is whether the trader had defined the expected movement, risk boundaries, adjustment criteria, and hold-to-expiration assumptions before the pressure arrived.

1
Payoff + CAR
Compare return potential and risk on a consistent capital basis.
2
Lifecycle
Define entry context, monitoring, HTE assumptions, adjustments, and exit.
3
Holdability
Design for clearer risk boundaries and more deliberate decision-making.

The workflow behind the Skyline research.

The OS connects structure design, CAR analysis, monitoring, adjustment evaluation, replay, and review. It supports the research process without being the only way to study or implement the strategy.

DESIGN

Structure + Risk

Build and compare configurations on a common CAR basis.

OPERATE

Monitor + Adjust

Evaluate live risk location and candidate changes in portfolio context.

LEARN

Replay + Review

Study outcomes against the original thesis and improve the process.

Dive deeper

Continue your Options Engineering journey.

After exploring the Skyline research, choose the educational, platform, or interactive experience that best matches your interest.

1
Strategy Engineering Program
Guided education on research interpretation and lifecycle methodology.
Explore coaching →
2
OS Early Access
Follow the integrated platform as it evolves.
Join early access →
3
SPX Closing Range Challenge
Join the launch list for the educational prediction experience.
Join the challenge list →
Free Options Engineering Blueprint

Get the free Options Engineering Blueprint and Skyline updates.

Download the free Options Engineering Blueprint and receive Skyline updates, methodology notes, and future releases.